Deviance Infographic.
A month-long personal experiment visualized: every time I said “no” was tracked and turned into an infographic. The project explores patterns in personal deviance and boundary-setting through clear, playful visual design.
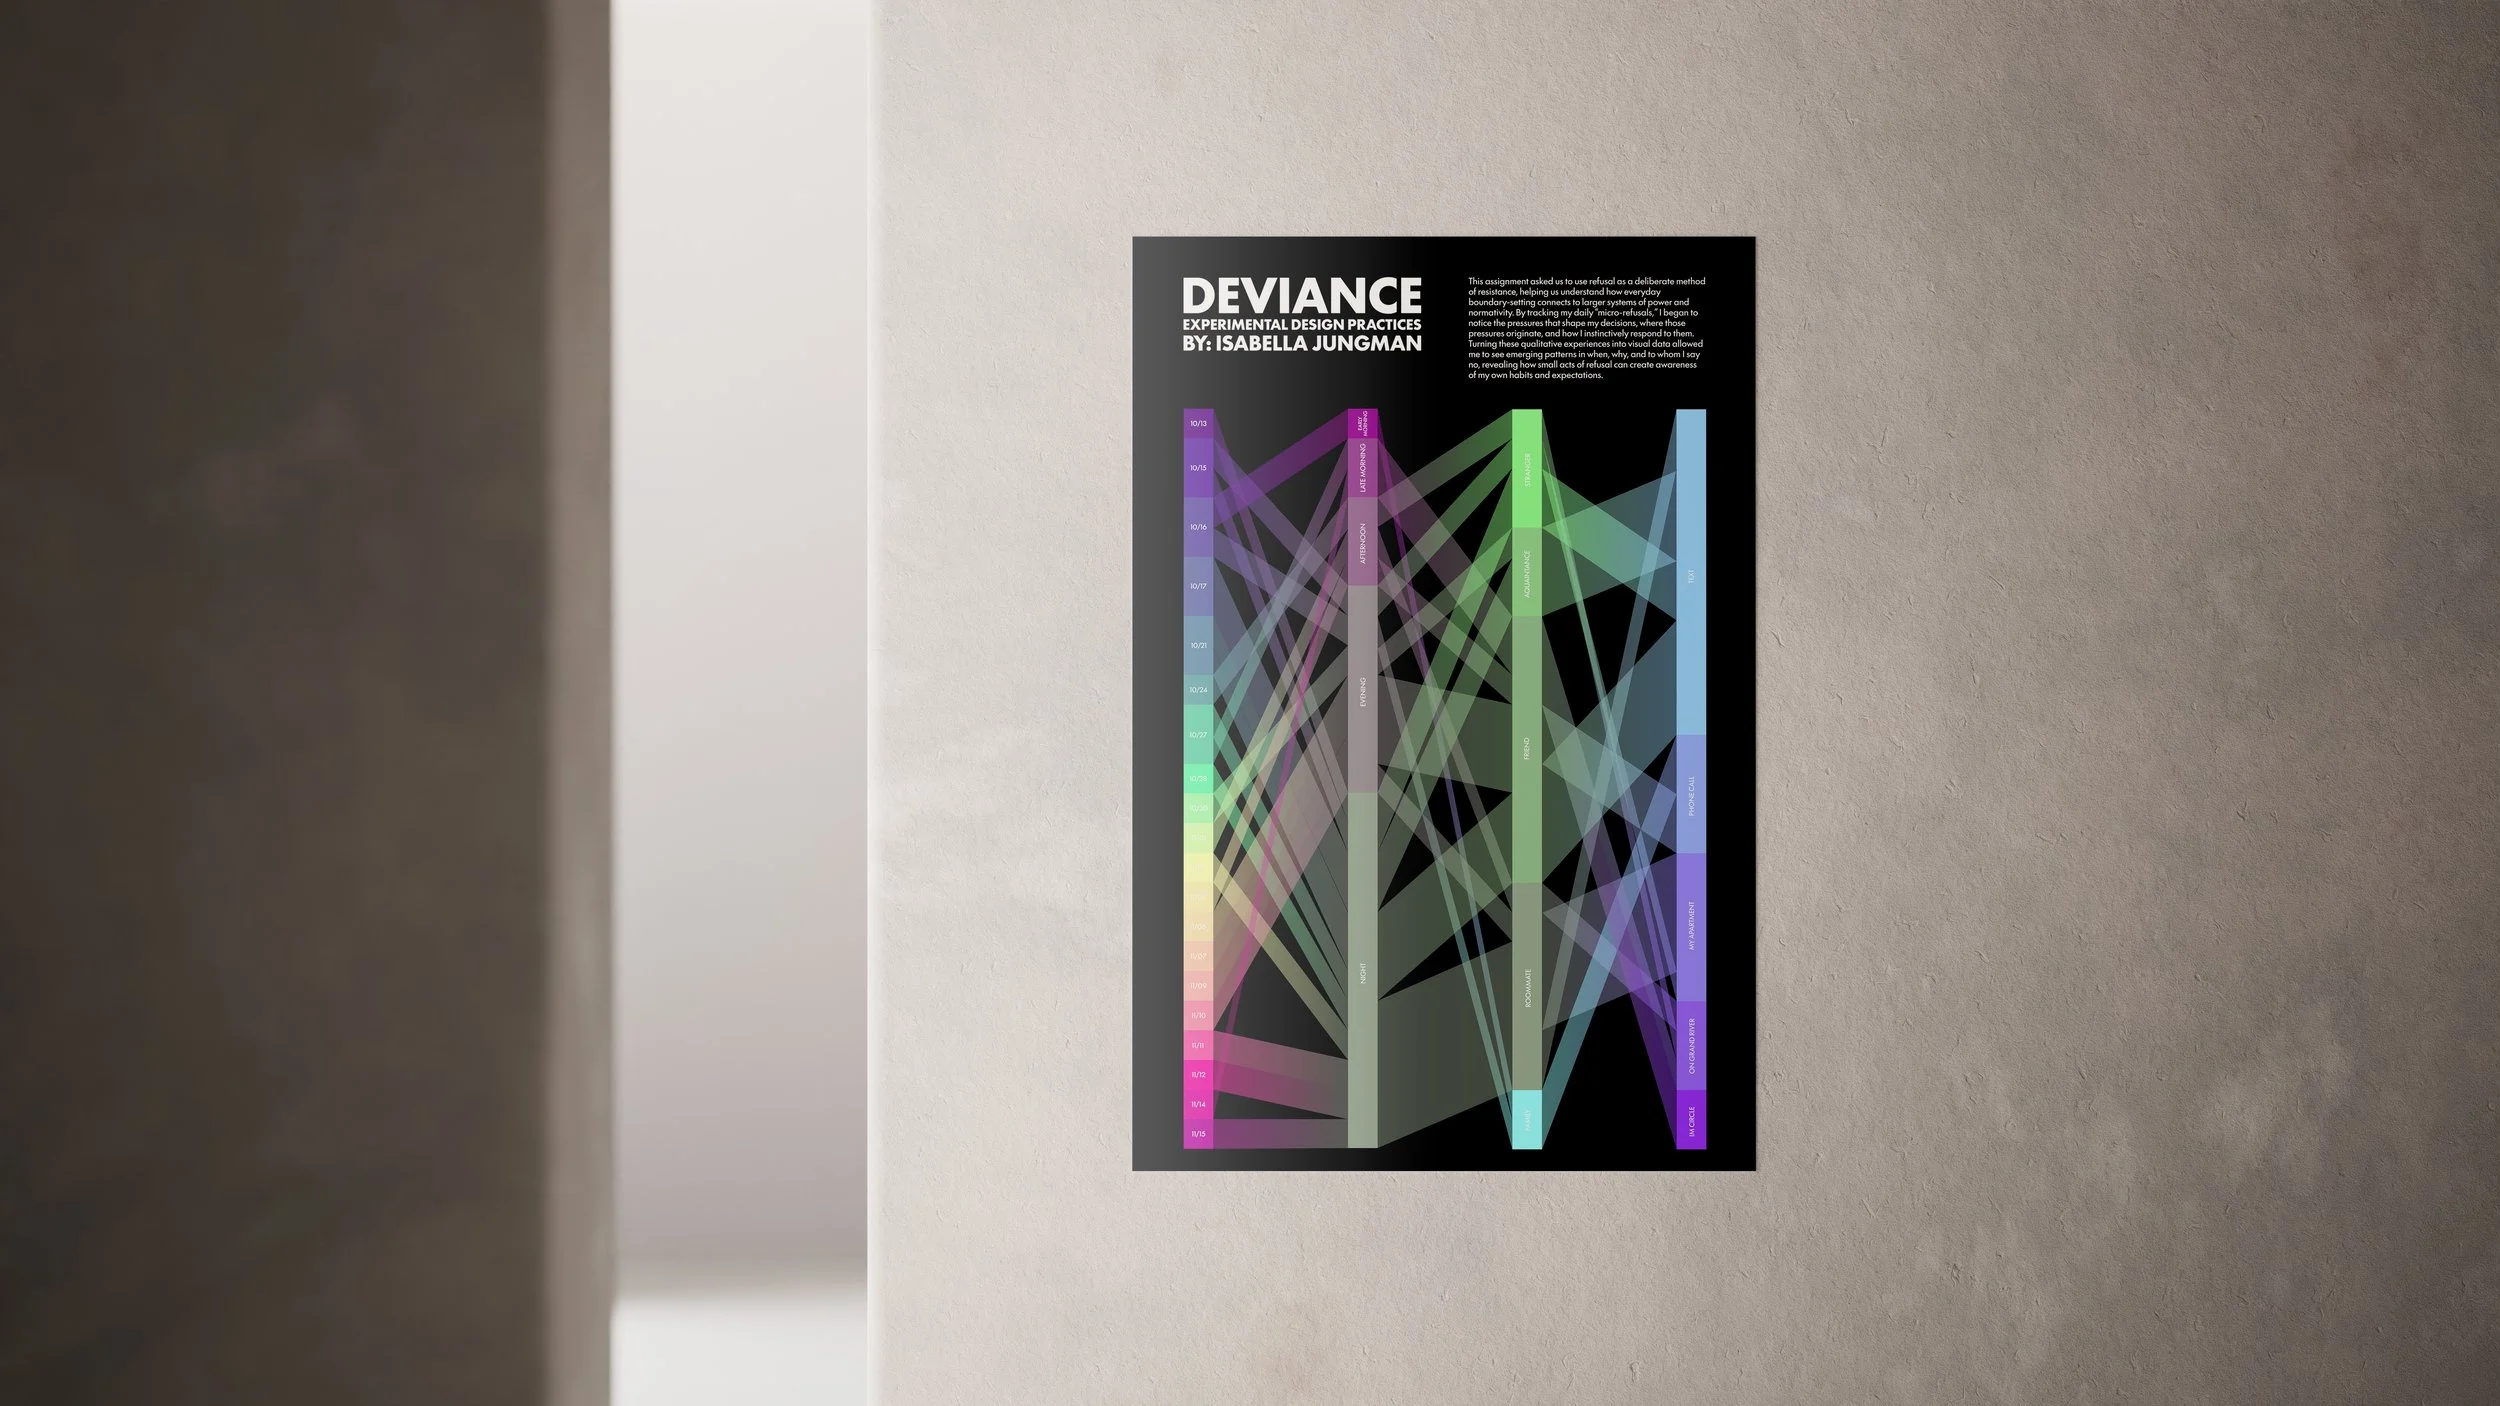
A month-long personal experiment visualized: every time I said “no” was tracked and turned into an infographic. The project explores patterns in personal deviance and boundary-setting through clear, playful visual design.